# Microsoft SQL
Microsoft SQL is the monitoring module for Microsoft SQL Server. You can monitor performance counters and get inventory reports for your SQL Servers and databases.
You can reach Microsoft SQL module monitoring and reports via left menu.
## ***Module Reports***
VirtualMetric collects following inventory reports for Microsoft SQL module.
**Bare Metal Reports**
```markup
Change Tracking
Event Log
Security Log
Firewall Log
Best Practices
Pending Updates
TCP Connections
Security Threats
File Change Tracking
User Sessions
Processes
Services
Hotfix
Programs
Windows Features
Windows Defender
Firewall Rules
Network Teaming
Startup Commands
Local DNS Records
Administrators
```
**Server Reports**
```markup
Config
Properties
Endpoints
Logins
Roles
Resource Pools
Availability Groups
Availability Group Listeners
Availability Group Replicas
```
**Database Reports**
```markup
Config
Properties
Mirroring
Recovery
Files
Tables
Stored Procedures
Users
Replicas
```
## ***Module Counters***
VirtualMetric collects following performance counters for Microsoft SQL module.
**Processor**
```markup
% C1 Time
% C2 Time
% C3 Time
% DPC Time
% Idle Time
% Interrupt Time
% Privileged Time
% Processor Time
% User Time
C1 Transitions/sec
C2 Transitions/sec
C3 Transitions/sec
DPC Rate
DPCs Queued/sec
Interrupts/sec
```
**Memory**
```markup
Available MBytes
Pages/Sec
Page Faults/Sec
% Committed Bytes In Use
Free System Page Table Entries
Pool Nonpaged Bytes
Pool Paged Bytes
```
**Paging File**
```markup
% Usage
```
**Network Interface**
```markup
Bytes Received/Sec
Bytes Sent/Sec
Packets Received/Sec
Packets Sent/Sec
Output Queue Length
```
**LogicalDisk**
```markup
Disk Reads/Sec
Disk Writes/Sec
Disk Read Bytes/Sec
Disk Write Bytes/Sec
% Idle Time
Split IO/Sec
Current Disk Queue Length
Avg. Disk Read Queue Length
Avg. Disk Write Queue Length
Avg. Disk Sec/Read
Avg. Disk Sec/Write
```
**PhysicalDisk**
```markup
Disk Reads/Sec
Disk Writes/Sec
Disk Read Bytes/Sec
Disk Write Bytes/Sec
% Idle Time
Split IO/Sec
Current Disk Queue Length
Avg. Disk Read Queue Length
Avg. Disk Write Queue Length
Avg. Disk Sec/Read
Avg. Disk Sec/Write
```
**Buffer Manager**
```markup
Buffer cache hit ratio
Database pages
Free list stalls/sec
Lazy writes/sec
Page life expectancy
Page lookups/sec
Page reads/sec
Page writes/sec
Readahead pages/sec
```
**Memory Manager**
```markup
Connection Memory (KB)
Database Cache Memory (KB)
Free Memory (KB)
Granted Workspace Memory (KB)
Lock Memory (KB)
Maximum Workspace Memory (KB)
Memory Grants Outstanding
Memory Grants Pending
Optimizer Memory (KB)
Reserved Server Memory (KB)
SQL Cache Memory (KB)
Stolen Server Memory (KB)
Target Server Memory (KB)
Total Server Memory (KB)
```
**SQL Statistics**
```markup
Batch Requests/sec
SQL Compilations/sec
SQL Re-Compilations/sec
```
**General Statistics**
```markup
Connection Reset/sec
HTTP Authenticated Requests
Logins/sec
Transactions
User Connections
```
**Access Methods**
```markup
Full Scans/sec
Index Searches/sec
Page Splits/sec
Table Lock Escalations/sec
```
**Locks**
```markup
Average Wait Time (ms)
Lock Requests/sec
Lock Timeouts/sec
Lock Waits/sec
Number of Deadlocks/sec
```
**Plan Cache**
```markup
Cache Hit Ratio
Cache Object Counts
Cache Pages
Cache Objects in use
```
**Databases**
```markup
Active Transactions
Bulk Copy Rows/sec
Bulk Copy Throughput/sec
Data File(s) Size (KB)
Log Cache Hit Ratio
Log Cache Reads/sec
Log File(s) Size (KB)
Log File(s) Used Size (KB)
Percent Log Used
Transactions/sec
Write Transactions/sec
```
**Database Files**
```markup
Read Bytes/Sec
Write Bytes/Sec
IO Reads/Sec
IO Writes/Sec
Total Space
Used Space
IO Reads
IO Writes
Read Bytes
Write Bytes
```
**Stored Procedures**
```markup
Elapsed Time
Worker Time
Physical Reads
Logical Reads
Logical Writes
Execution Status
```
**Index Stats**
```markup
Allocated Space
Used Space
Free Space
Row Count
User Seeks
User Scans
User Lookups
Fragmentation Count
Page Count
% Fragmentation
% Space Usage
```
**Table Stats**
```markup
Allocated Space
Used Space
Free Space
Row Count
% Space Usage
```
**Database Replica**
```markup
Recovery Queue
Redone Bytes/sec
Log Send Queue
Log Bytes Received/sec
File Bytes Received/sec
Mirrored Write Transactions/sec
Transaction Delay
Total Log requiring undo
Log remaining for undo
Redo Bytes Remaining
Redo blocked/sec
Synchronization State
Commit LSN
End Of Log LSN
Hardened LSN
Received LSN
Redone LSN
Sent LSN
Recovery LSN
Commit State
Hardened State
Received State
Redone State
Truncation LSN
```
**Availability Replica**
```markup
Bytes Sent to Replica/sec
Sends to Replica/sec
Bytes Sent to Transport/sec
Sends to Transport/sec
Bytes Received from Replica/sec
Receives from Replica/sec
Flow Control Time (ms/sec)
Flow Control/sec
Resent Messages/sec
Member State
Connection State
Synchronization State
Connection Error
```
## ***User Permissions***
If you want to use non-administrator user for VirtualMetric, you need to add the following changes for the user account in addition to Bare Metal permissions.
**MSSQL Service Configuration**
You need to open CMD window to configure Security Descriptions for MSSQLSERVER Service. Type following command on CMD:
```markup
sc sdshow mssqlserver
```
You will see default security descriptor of the MSSQLSERVER Service.
Add the following security descriptor to MSSQLSERVER security descriptions:
```markup
(A;;CCLCRPRCLO;;;AU)
```
\
Update the Security Description via following command:
{% code overflow="wrap" lineNumbers="true" %}
```markup
sc sdset MSSQLSERVER D:(A;;CCLCRPRCLO;;;AU)(A;;CCLCRPRC;;;IU)(A;;CCLCRPRC;;;SU)(A;;CCLCRPWPRC;;;SY)(A;;KA;;;BA)(A;;CC;;;AC)S:(AU;FA;KA;;;WD)(AU;OIIOFA;GA;;;WD)
```
{% endcode %}
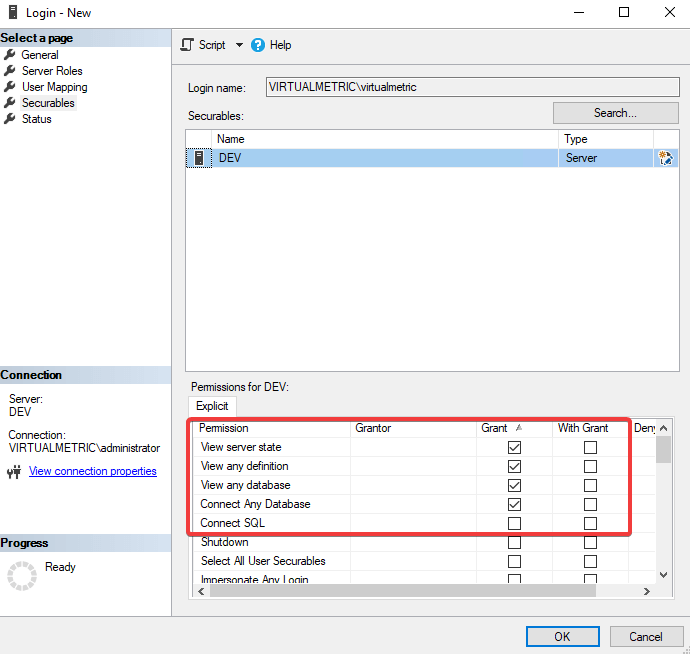
**SSMS User Configurations**
Using SSMS add user to Server Logins:
Choose user and click OK button:
From Securables tab select Search and choose The Server selection.
And enable the following permissions:
**Login Securables Options**
```markup
Connect Any Database
View any database
View any definition
View server state
```
## ***Requirements***
Following SQL components are required to monitor Microsoft SQL:
```markup
SQL Server Shared Management Objects (SMO)
```
You can install required components via following MSI package:
```markup
ENU\x86\SharedManagementObjects.msi
```
Following Windows features are required to monitor Microsoft SQL Clusters:
```markup
Failover Cluster Module for Windows PowerShell
```
You can install required features with following PowerShell command:
```markup
Get-WindowsFeature RSAT-Clustering-PowerShell | Add-WindowsFeature
```
---
# Agent Instructions: Querying This Documentation
If you need additional information that is not directly available in this page, you can query the documentation dynamically by asking a question.
Perform an HTTP GET request on the current page URL with the `ask` query parameter:
```
GET https://docs.virtualmetric.com/modules-and-audit/virtualmetric-modules/microsoft-sql.md?ask=
```
The question should be specific, self-contained, and written in natural language.
The response will contain a direct answer to the question and relevant excerpts and sources from the documentation.
Use this mechanism when the answer is not explicitly present in the current page, you need clarification or additional context, or you want to retrieve related documentation sections.